March 2023
|Last updated:July 2024
What is a charging curve?
Whether you’re an EV driver (or just an EV passenger), you’ve more than likely heard someone ask, why isn’t my EV charging as quickly as it should?
Although charging speeds can be affected by many factors*, an EV’s charging curve is one of the most prominent. So, what is a charging curve? And does it differ from EV to EV?
(*If you’re interested in reading about the other factors, check out our blog: What affects your EV charging speed?)
Let’s get plugged…
What is a charging curve?
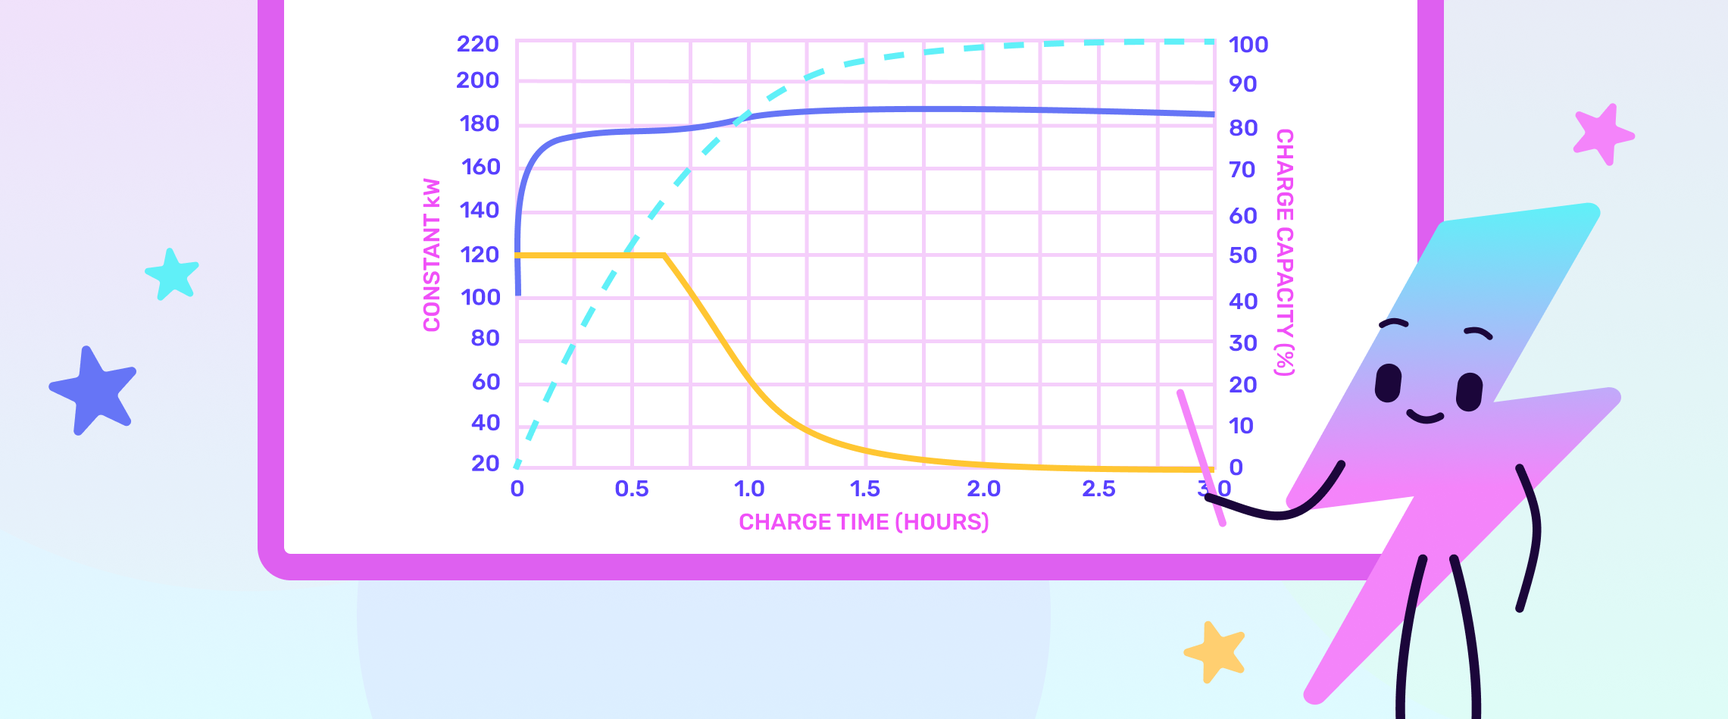
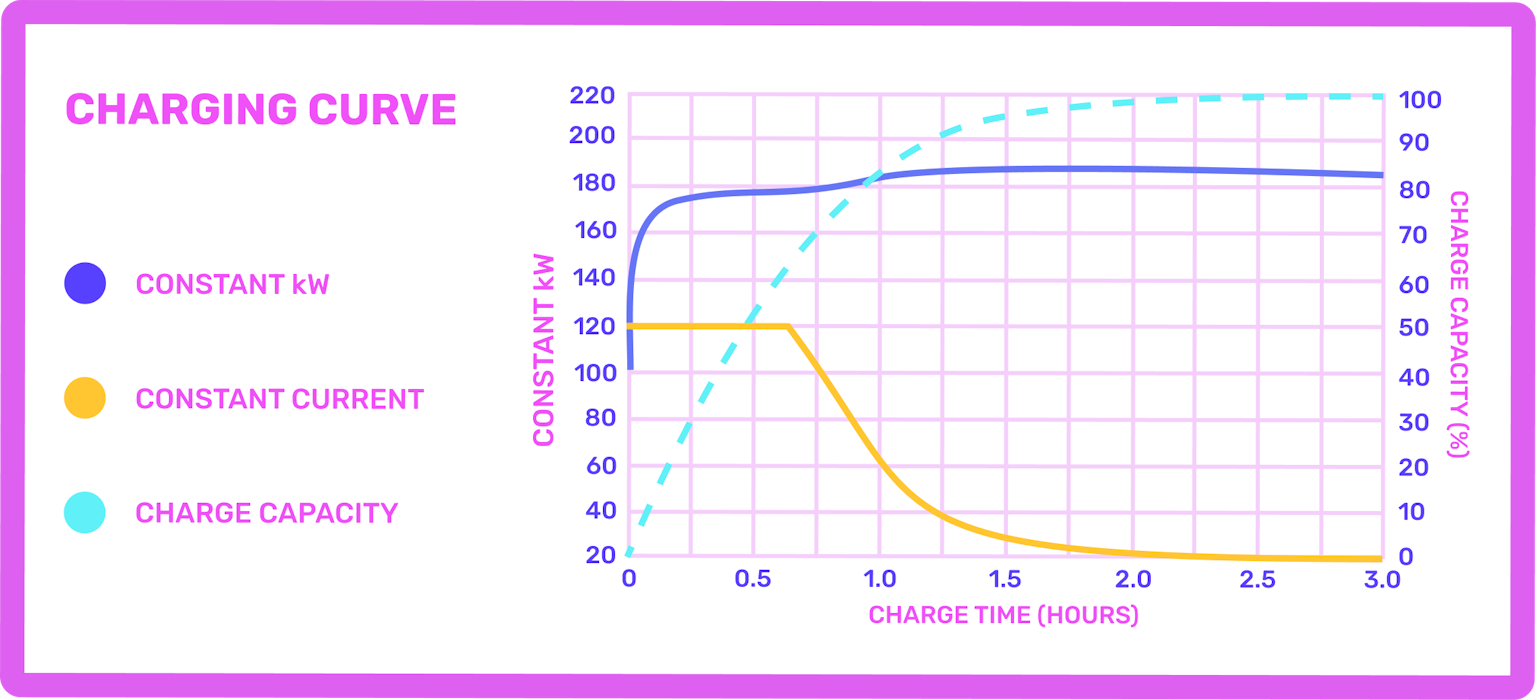
Every EV has a charging curve, and this represents the fluctuation in speed during a charging session. You may have noticed during charging sessions that an EV will charge notably faster when the battery percentage is between 20 - 80% - outside of this range the charging speeds decrease. Why?
To protect the battery.
The lithium-ion battery is an EV’s powerhouse, and part of its manufacturing process is to install rigorous safety procedures to guarantee battery health. One of these safety procedures is the gradual warming and cooling of the battery during a charging session, to ensure it doesn’t become overheated or damaged (which could result in loss of mileage!). We’ll explain this a bit more in the next section.
It’s also worth noting that every EV has a maximum charge rate, which can also impact the charging curve. For example, the Renault Megane E-Tech has a maximum rate of charge of 129 kW, meaning that despite being plugged into a 350 kW charger, it will never draw more than 129 kW. The E-Tech also has an onboard charger with a max rate of 22 kW, which means that when plugged into a 43 kW AC charger, the EV will never draw more than 22 kW.
You can check an EV’s maximum rate of charge by either checking the vehicle handbook or using online tools (such as Osprey’s EV Charging Speed Calculator).
Why is a charging curve important to EV battery health?
Although slower charging speeds can seem inconvenient, the charging curve is essential to EV battery health and available mileage.
When you plug your EV into a charger, the ions within the individual battery cells are charged and moved between the cell’s anode and cathode. If this happens too quickly, the battery pack may become overheated and lose some efficiency, meaning fewer miles per charge. Fortunately, there are safety features in place which prevent this from happening and gradually warms the battery before it reaches its maximum charge rate. This is why when you plug your EV into a 150 kW charger at 15%, it may only draw 44 kW for the first few minutes.
As the battery warms, the charging speed should increase until the EV’s maximum charge rate is met (e.g. 125 kW). The reverse process will occur once the EV reaches around 80% - the battery will start to cool itself, and the charging speed will decrease.
Cosmic fact! In addition to the charging curve and state of charge, charging speeds are dependent on a few other factors (such as power-sharing charging hubs, ambient and battery temperatures, cable limits etc.). Read our blog to learn more about what affects your charging speed.
What percentage should an EV be charged to?
To protect battery health, you should aim to keep your EV battery percentage between 20 - 80%. Of course, this isn’t always possible (long road trips, unexpected detours, traffic jams etc.), but it’s good guidance to ensure battery health and keep range degradation at bay.
Your desired charge percentage will also vary depending on where you are charging.
For instance, when using a public charger, it’s common practice for drivers to charge to 80 - 85% and move on - freeing up the space for the next person in need of a charge. On the whole, the last 15 - 10% of a battery charge takes the longest (as the battery starts to cool and charging speeds decrease), meaning that you could be waiting as long as you have for the initial charge. This also means that it’s far more expensive to charge the last 15% of an EV’s battery at a public charger.
Something to keep in mind!
Does the charging curve differ for different EVs?
Yes, it does! Some EVs can charge consistently at a higher rate than others - on the whole, this is true of newer models.
Regardless of which EV you drive, we always recommend getting to know its charging curve, as it can help you charge more efficiently (and cost-effectively!) at public charge points.
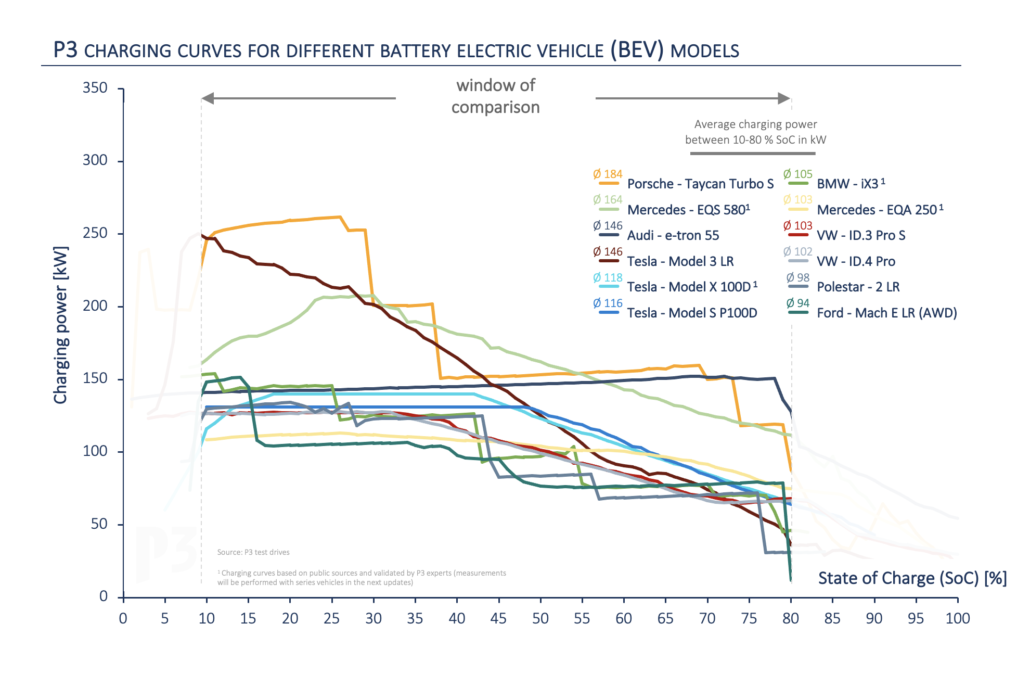
To demonstrate how varied the charging curve can be, the P3 group tested the average charging speed of 12 electric vehicles (including Tesla Model 3 LR, Volkswagen ID.4, Polestar 2, and BMW iX3) using the battery parameters of 10 - 80%.
The results show that from the 12 electric vehicles tested, the Audi e-tron 55 kept a steady charging rate of 146 kW, whereas the Porsche Taycan Turbo S and Tesla Model 3 LR both had a far more varied charging curve. The Porsche averaged 184 kW for the charging session, whereas the Tesla averaged 146 kW.
Feeling enlightened or do you think something was missing? Let us know by sharing your feedback.
Interested in learning more? Head over to our Electroverse community area for more electrifying content.